

We have introduced a state-of-the-art patient-specific computational modelling technique, the full-scale airway network (FAN) flow model [1]. The FAN model uses structural data extracted from CT images of patients and simulates dynamic flow parameters in the lungs. The FAN provides an accurate assessment of regional lung ventilation.

Figure 1. Full-scale airway network (FAN) flow model studies. Comparison of lung ventilation computed in FAN versus pulmonary function imaging data sets (Hyperpolarized Xenon-129 MRI, Ventilation-SPECT and Xenon-enhanced dual energy CT).
FAN model for COPD
The FAN modelled ventilations in COPD lungs was compared with pulmonary functional images (Hyperpolarised Xenon-129 MRI, ventilation SPECT, Xenon-enhanced dual-energy CT). The FAN has demonstrated significant correlations in ventilation distribution with the imaging data (Figure 1) [2,3]. The advance in modelling technique with the FAN can help personalised level diagnosis of small airway disease [4,5]. The FAN is being further developed for application in both scientific research and clinical practice.
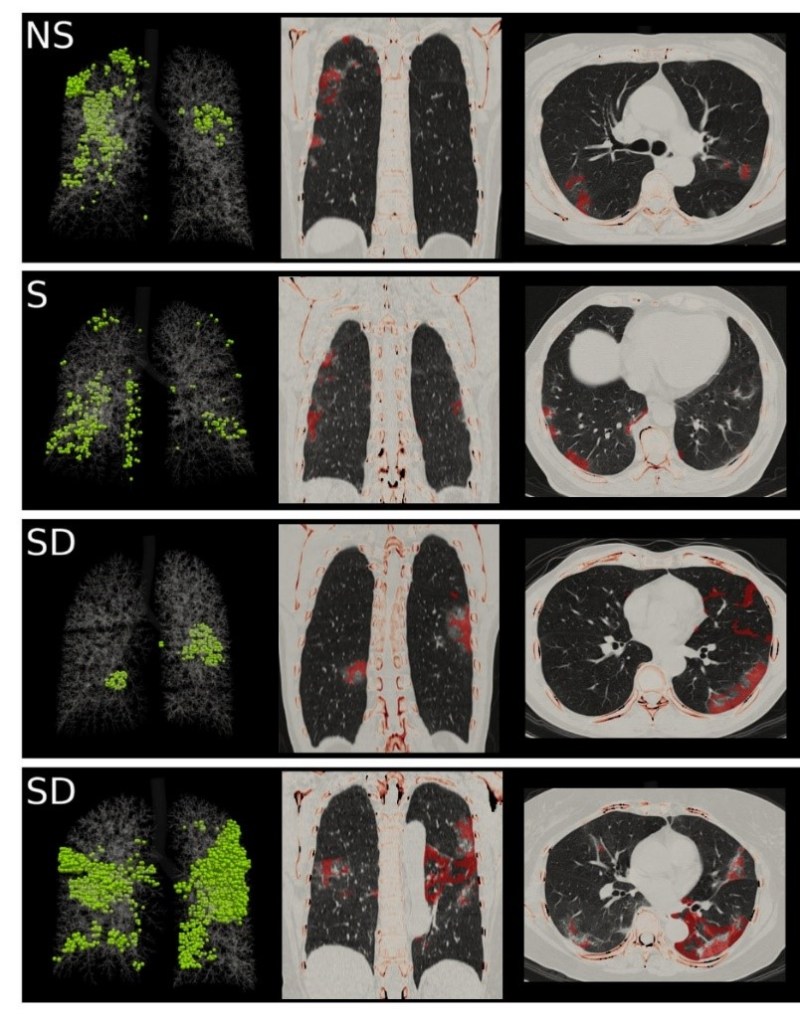
Figure 2. FAN flow model geometry and COVID-19 CT images. Green spheres in the left column indicate the pneumonia lesion segmented from CT images. The middle and right columns show FAN modelled ventilation defect (red-coloured layer) on a coronal plane and a transverse plane of a CT scan. The cohort is categorized into no symptom (NS), a symptom without dyspnea (S) and symptom of dyspnea (SD) cases.
FAN model for COVID-19
In a recent case study, an extension of the FAN modelling technique, we simulated lung ventilation in a patient with COVID-19 [6]. A deep learning-based CT analysis algorithm was used to identify radiological futures of COVID-19 pneumonia for the FAN modelling. The AI algorithm and FAN modelling demonstrated morphologic and functional lung abnormalities in COVID-19 patients, facilitating individualised treatment guidance and sequelae surveillance. In a follow-up study of FAN modelling with a larger cohort, functional and radiological features were compared across groups regarding the clinical symptoms (Figure 2).
References
- M. Kim, R. Bordas, W. Vos, R. A. Hartley, C.E. Brightling, D. Kay, V. Grau, K.S. Burrowes, “Dynamic flow characteristics in normal and asthmatic lungs”, Int J Numer Meth Biomed Eng, 31(12), 2015. doi: 10.1002/cnm.2730.
- M. Kim, O. Doganay, T Matin, T. Povey, F. V. Gleeson, “CT-based Airway Flow Model to Assess Ventilation in Chronic Obstructive Pulmonary Disease: A Pilot Study”, Radiology, 293(3): 666-673, 2019. doi: 10.1148/radiol.2019190395.
- M. Kim, O. Doganay, H. J. Hwang, J. B. Seo, F. Gleeson, “Lobar ventilation in patients with COPD assessed by the full-scale airway network flow model and xenon-enhanced dual-energy CT”, Radiology, 298(1): 201-209, 2021. doi: 10.1148/radiol.2020202485.
- M. L. Schiebler , G. Parraga, “Visualization of the Small Airways: What It Is and Why It Matters”, Radiology, 293(3): 674–675, 2019. doi: 10.1148/radiol.2019192025.
- G. Parraga, R. L. Eddy, “Measuring Regional Pulmonary Function Using Noncontrast CT: More Reasons to Join the FAN Bandwagon”, Radiology, 298(1): 210-211, 2020. doi: 10.1148/radiol.2020203983.
- S. Yoon and M. Kim, “Anterior Pulmonary Ventilation Abnormalities in COVID-19”, Radiology, 297(2): E276-E277, 2020. doi: 10.1148/radiol.2020203043.
